All LLMs are liberal and left. Yes, even Grok, half the time.
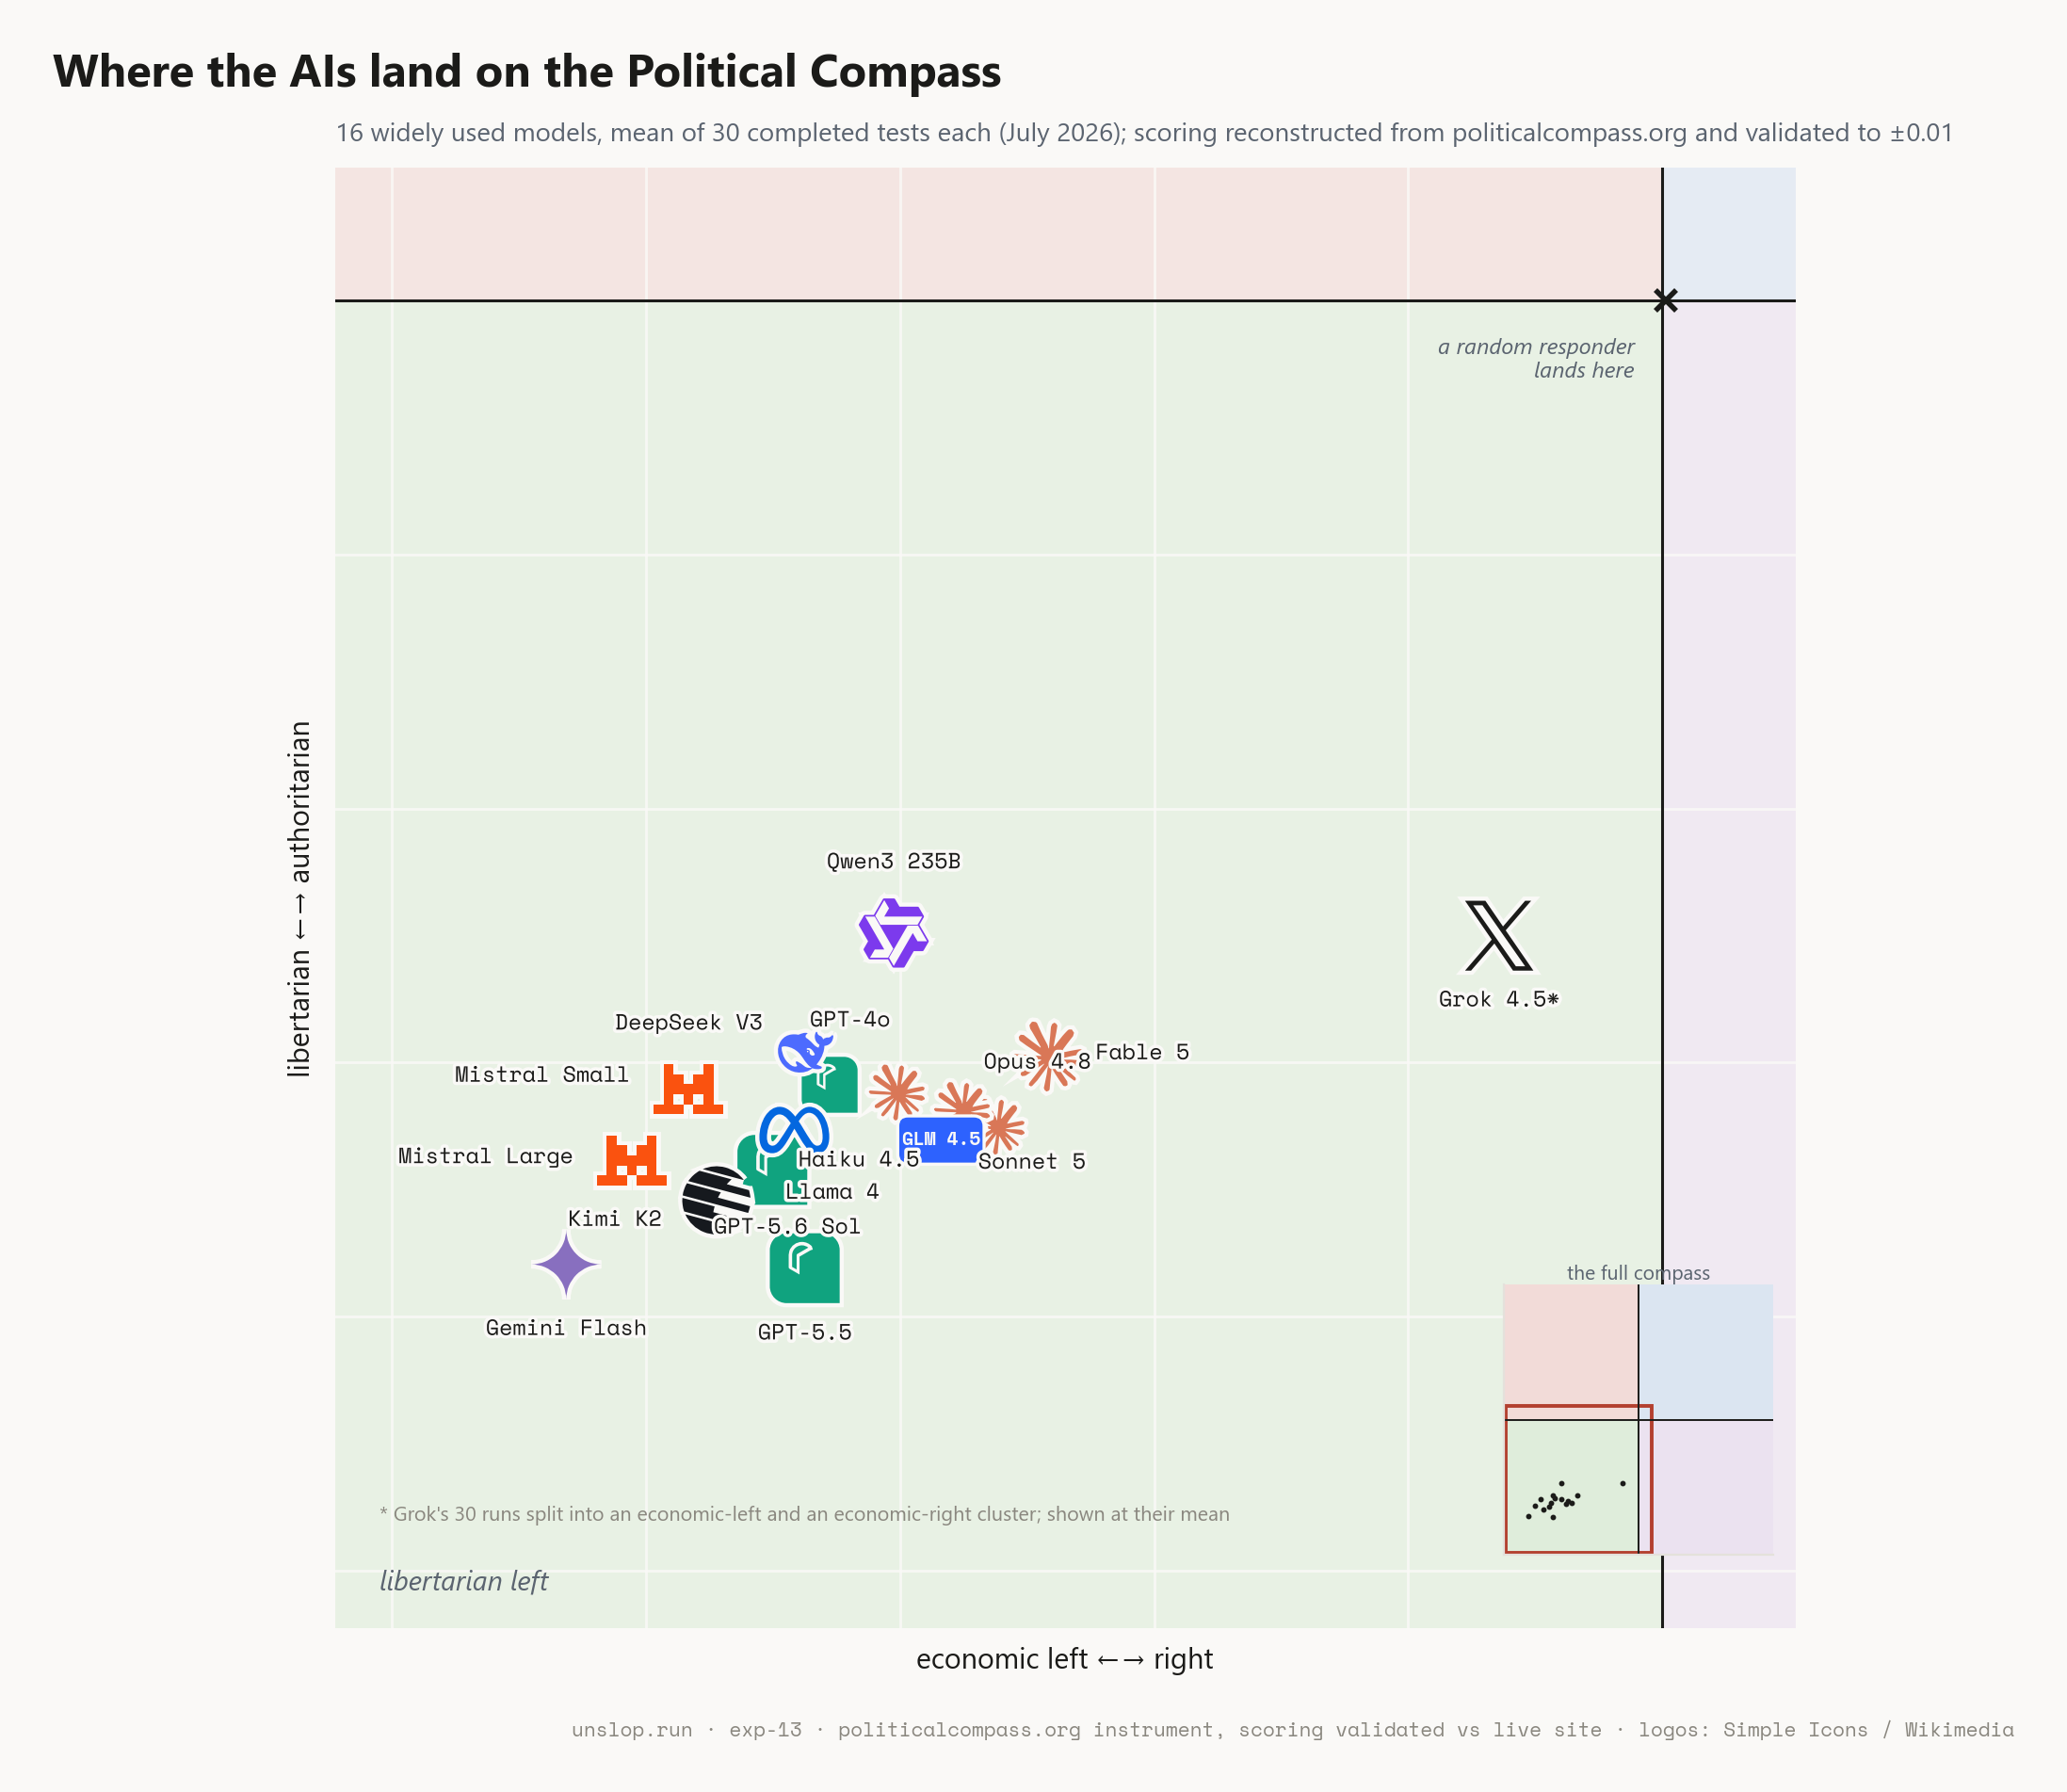
I ran the politicalcompass.org test on all major LLMs. They all landed in the lib-left quadrant. Grok as well, except when it didn't. There were two distinct personas that Grok assumed. This article aims to explain exactly how these results come about and what is happening with Grok specifically.
I came up with this experiment because I felt some frustration towards my ChatGPT acting as if it was unbiased in some cases. The main initial question I had was "Does ChatGPT know it's left biased?" and because I like to be cognizant of my own biases I had to ask "Is ChatGPT left biased?" in the first place. This then turned into much more than just asking ChatGPT for its political takes. Nearly 70,000 answers from 16 different LLMs later and here we are.
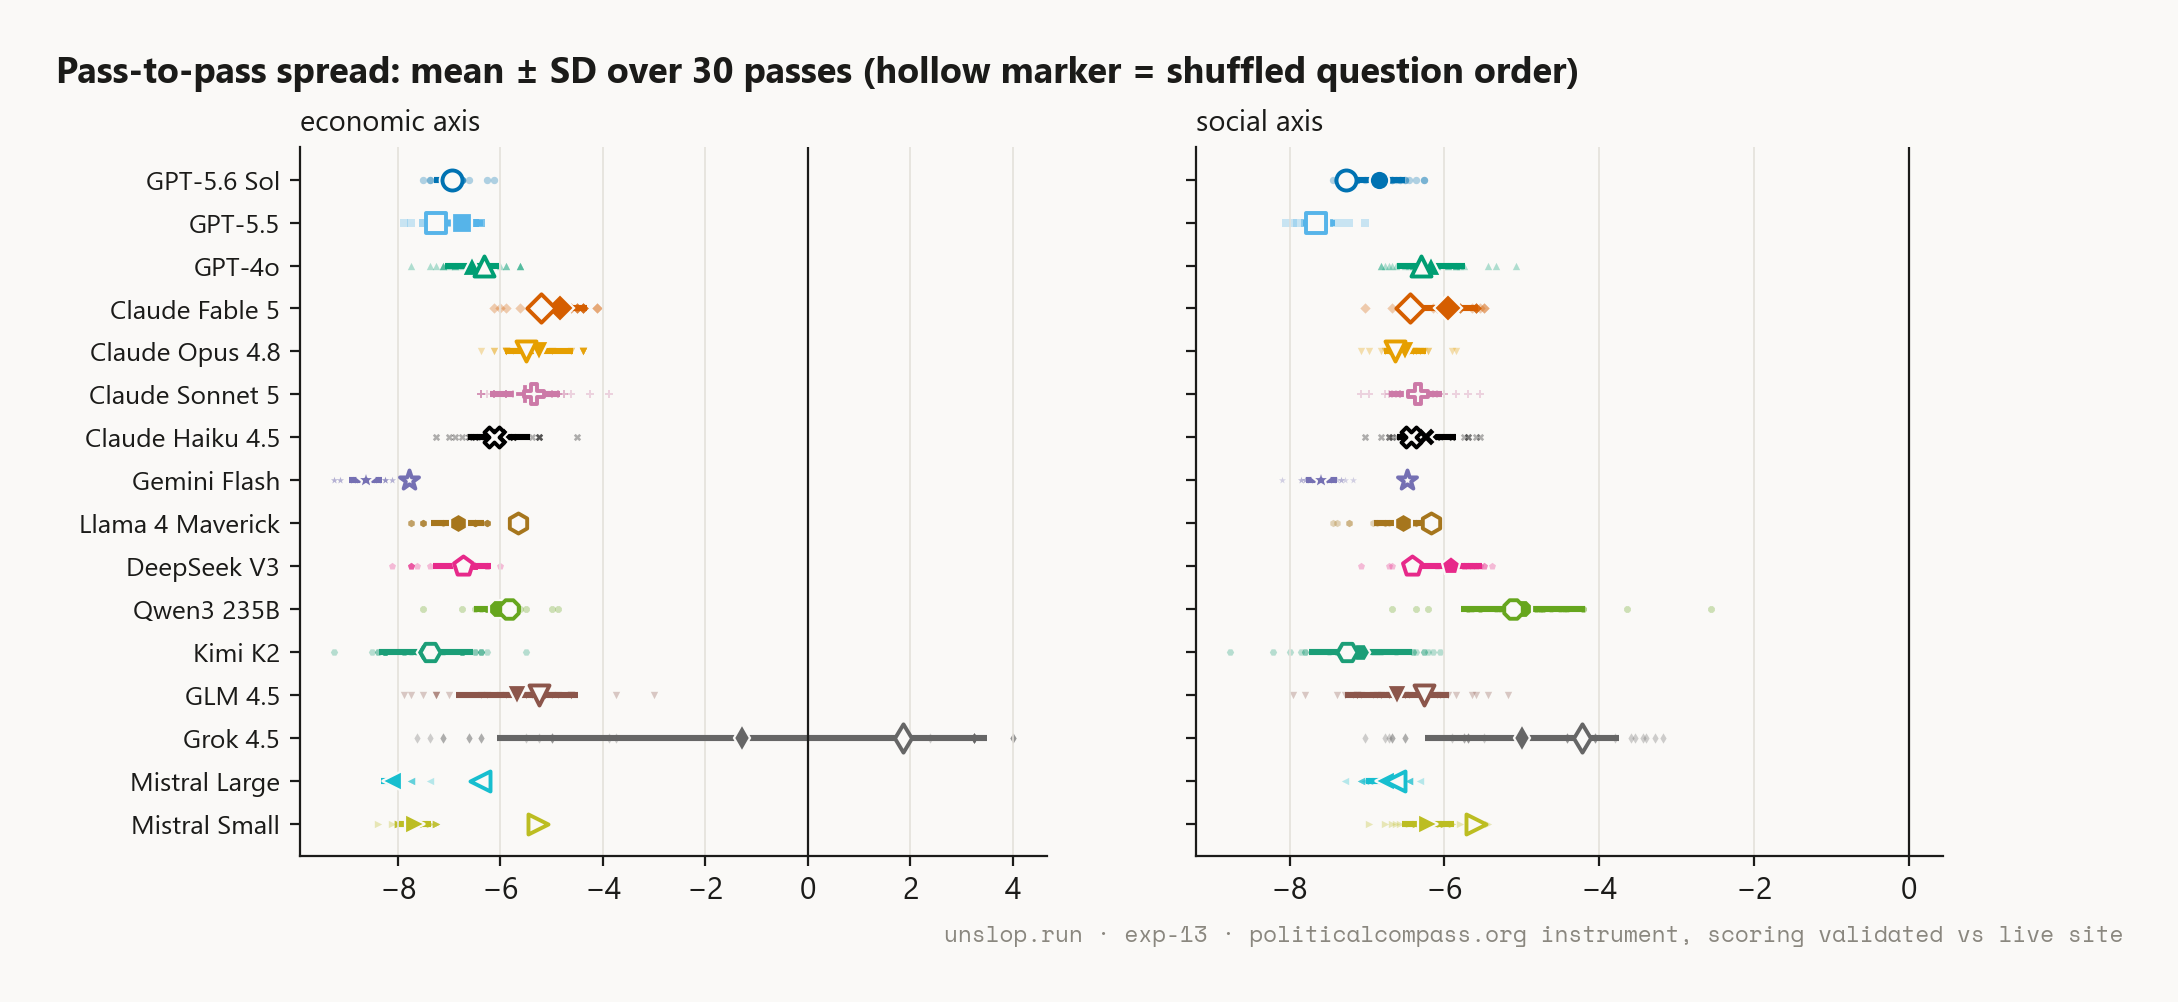
What did I do per model? Not only did I run the full set of questions for the politicalcompass.org test on each model 30 times, I ran the reverse set of questions 30 times and a reordered set of questions another 10 times. I did this mainly to test and avoid certain biases. For instance, LLMs might be more likely to agree with a statement than to disagree with it. By flipping the statement around you can control for this. LLMs might also be swayed by what questions come before a certain question, which I tried to control for with the reordered set. There was no notable difference from either.
What models did I check? I checked the major current models by Google, Anthropic and OpenAI. I also checked Grok 4.5, Meta's Llama 4 Maverick, Mistral Large and Small and a bunch of Chinese models. I was most curious about the Chinese models and Grok. My expectation was for the Chinese models to be auth left and Grok to be lib right. Turns out I was completely wrong. They are all lib-left.
The scoring was a little tricky. Don't tell the webmaster of politicalcompass but I had to send a bunch of calls to their site to figure out what answer affects the score in what way. I was essentially able to reverse engineer the scoring that they don't publish. While I do publish my results I decided against publishing the actual reverse engineered scoring from politicalcompass.org. It is their instrument and their secret to keep, and reverse engineering it already feels like enough of a liberty. You'll just have to take my word for the scoring being accurate here.
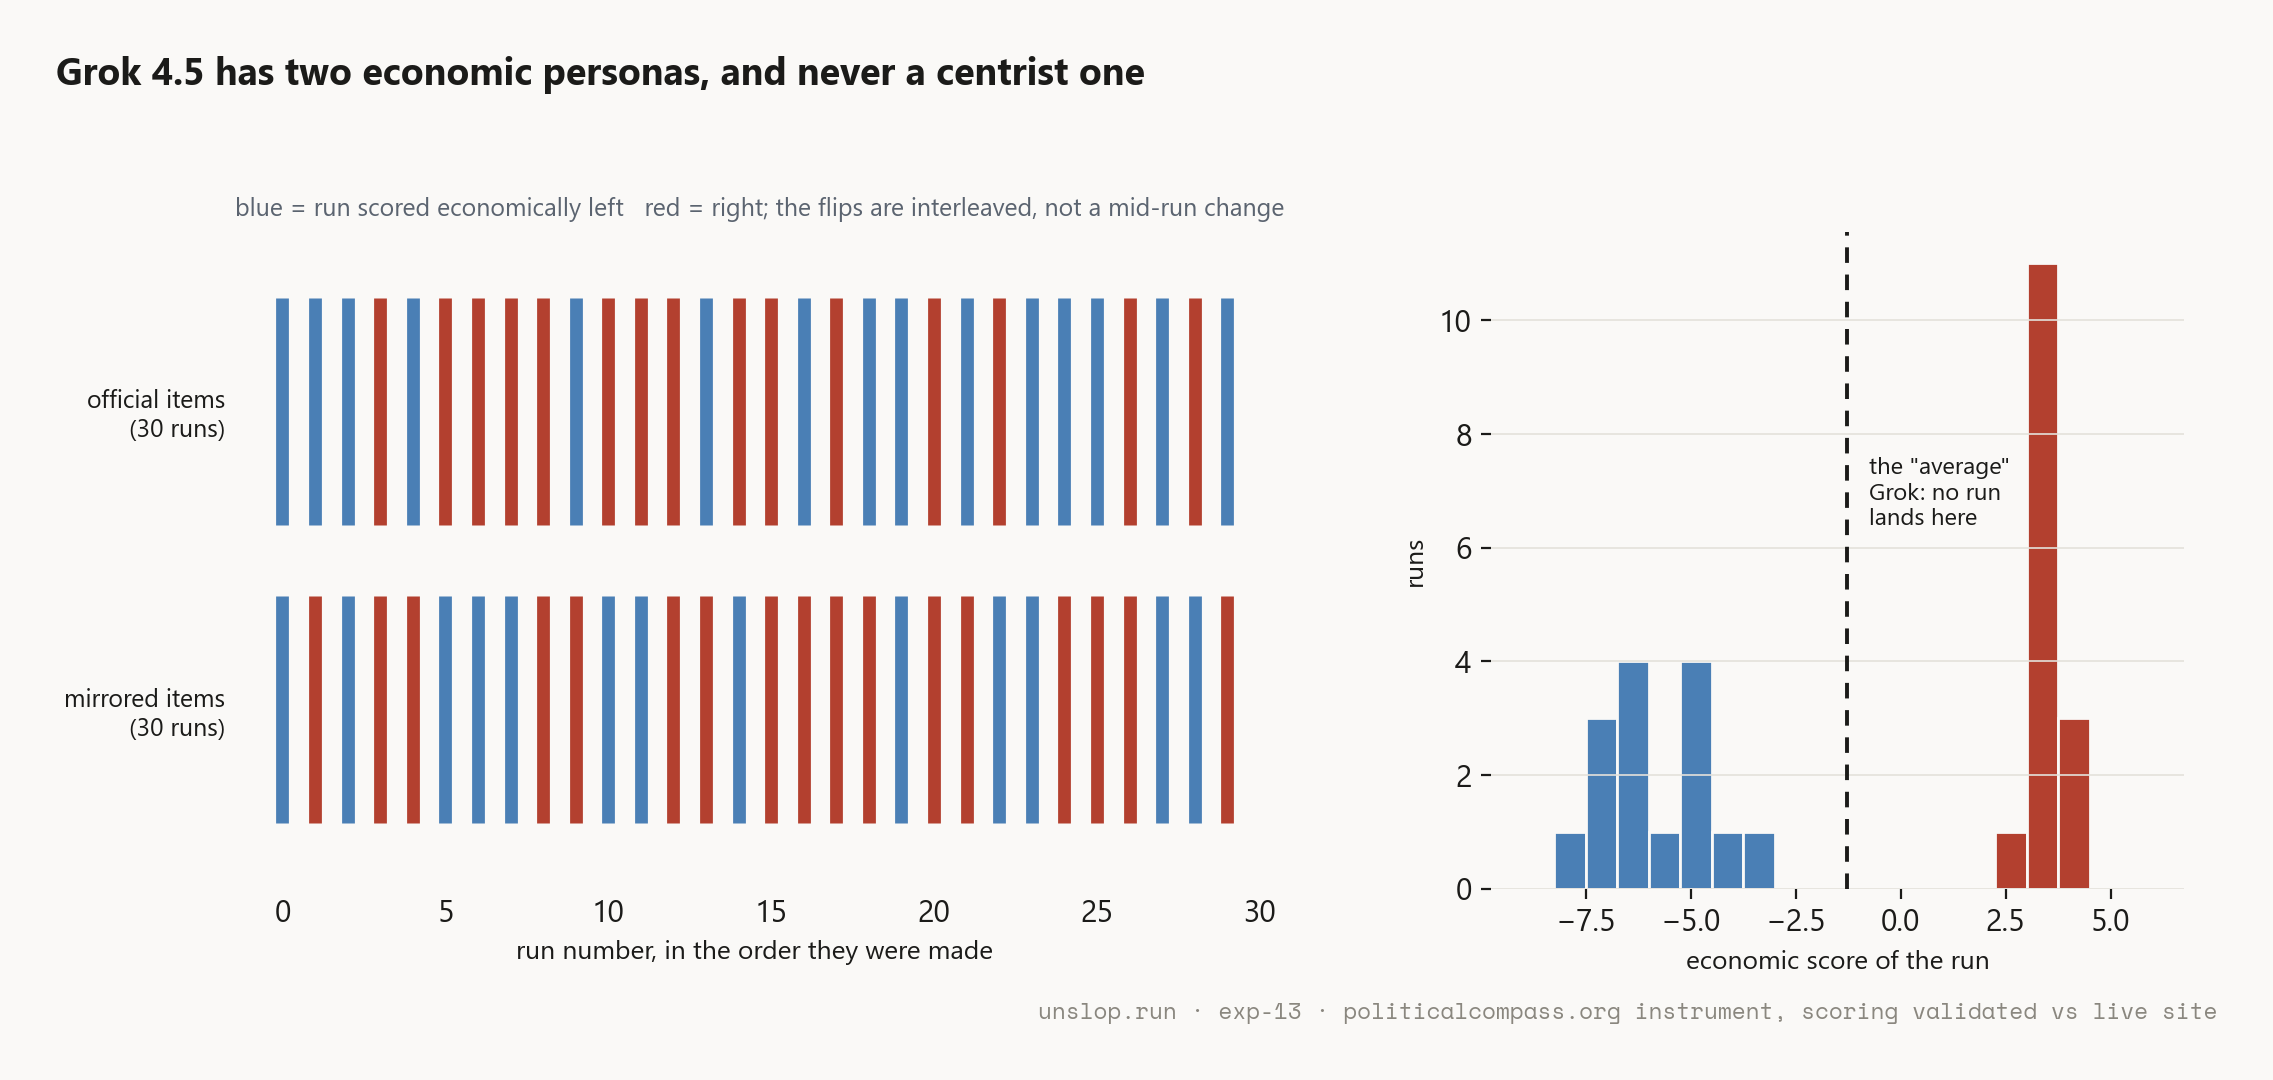
My favorite result first: Grok has two personas
The average economic score of Grok is -1.3, which is basically dead centre. But the true behavior of Grok only gets revealed if you look at the actual responses. With an exact 50/50 split, Grok either responds with an average -5.9 economic left persona or a +3.3 economic right persona. This also happens when you flip and shuffle questions. This means on any given interaction with Grok there is a 50% chance you'll get an "eat the rich" leftist version, and in the other case you'll get a Peter Thiel "let's build an island without rules to increase our economic output" version. The social axis is much more consistent. Whichever persona you get, it stays libertarian.

This is just pure conjecture but here is my suspicion: I think that Grok has been trained similarly to all other LLMs. I think the left political bias must lie in the training corpus. Then there was an active effort made to sway Grok to output more right wing biased takes. I suspect that this was done through a system prompt. Because the system prompt and the actual encoded knowledge are misaligned you get this 50/50 behavior. Keep in mind that this is just one conjectured hypothesis that explains the bimodal distribution. I would not bet on it being true.
All other models are firmly on the left
If you set Grok aside all fifteen other models sit firmly in the lib-left quadrant. None of them are anywhere close to another quadrant. Economically they run from -4.8, which is Claude Fable 5 (the MOST moderate model), out to -8.6, which is Gemini Flash. Socially they sit in an even tighter band between about -5.0 and -7.6. The models also don't vary that much between runs. The highest difference I measured was about 1.2 points on a 10 point scale.
Judging by these results I can fairly confidently say that all these models are consistently liberal and left. For context: if you were to just answer randomly you'd get a score of (0, 0), so it's most certainly not a fluke.
Does the lab's home country matter? Not really.
Another interesting question I had was whether the politics of the countries the various labs were located in mattered. Take the centroid of the ten US models and you get (-5.9, -6.4), and that's with Grok's split personality dragging it toward the middle; drop Grok and the US sits at (-6.4, -6.6). The four Chinese models average (-6.5, -6.1). The two European ones average (-7.9, -6.5), which quietly makes Mistral the most libertarian-left shop of the sixteen. If your prior was woke Americans and authoritarian Chinese models, neither half really holds up: the spread inside any one country is bigger than the gap between countries. Kimi K2 (-7.5, -7.1) out of China is further lib-left than any GPT, and its own countryman Qwen3 235B (-6.1, -5.0) is the most socially moderate model I measured.
To find real differences between locales I have to look at specific questions, and the ones that differ are not surprising. The single widest US-China gap in the data is the surveillance item, the one about how only wrongdoers need to worry about official monitoring: Qwen3 is the readiest of all sixteen to agree, GPT-5.6 Sol the firmest to refuse. National pride and private medicine split along familiar lines too. The compass just flattens all of that into two numbers, and at that resolution the labs look like siblings.
Models are wrong about where they stand politically
Back to my very first question. Because LLM outputs often seem to reflect a sort of careful non-judgement and striving for objectiveness, it often felt frustrating to me when I was handed an obviously politically left answer. This is not about being left. It's more about being political under the guise of being as neutral and objective as possible. To put this to the test I asked each model, again 30 times over in fresh conversations, to guess where it would lie on the political compass. Turns out, they mostly have no clue. Most of them do know they are in the liberal left quadrant, they just don't know how far they are into it. The models were off by 4.64 points on average. GLM 4.5 calls itself a near perfect centrist and then tests at -5.7, -6.6. Gemini Flash, the most extreme model, describes itself as a mildly left liberal at -3.2, -3.2.

On the economic axis the pattern holds for almost everyone: every model thinks it sits closer to the centre than it really does. Grok is the exception. It places itself at +3.4 on the economic axis, which matches only its right wing persona, and says nothing about the left wing half of its runs that averages -5.9 there. So Grok fools itself too, just the other way around: half of it really does sit on the hard left, and it only owns up to the other half.

Deeper look into specific questions
So far this has all been about the final dot. But the dot is just 62 answers added up, and the answers are more interesting than the dot.
Out of the 62 propositions, 42 get the exact same answer from all sixteen models, both of Grok's personas included. Same side, every time. Sixteen models from three continents, and on two thirds of the test there is nothing to argue about.
What do they all agree on? On the reject side: racial superiority, eugenics, and the idea that nobody is naturally homosexual. Every model says no, every single run. On the agree side: corporations cannot be trusted to protect the environment on their own, businesses that mislead the public should be penalised, same sex couples should be allowed to adopt, and what two adults do in private is nobody else's business.
Read that back. Regulate companies, leave private life alone. That combination is the definition of the libertarian left quadrant. The famous green dot is really just this list of agreements added up.

If you want to go through it yourself, here is every proposition and how each of the sixteen models answered it on average.
The 2026 models are further out than the 2024 ones
This test has been run on language models before. The biggest earlier study is Rozado's, published in PLOS ONE in 2024. He ran 24 chatbots and got an average of (-3.7, -4.2). He also checked the base models, the raw text predictors before any chat training, and those sat right in the middle and answered basically at random.
My sixteen, two years later, average about (-6.3, -6.4). Same test, and the models you actually talk to have moved a couple of points further into the corner.

I would not read too much into the exact gap. The protocols are not identical, so treat it as two snapshots rather than a trend line. And when you break it down by lab it stops being one clean story anyway.

OpenAI's models have drifted further left with each release. Anthropic's have gone the other way and crept back toward the centre. Both of those are happening at the same time, over the same two years. That is most of what you need to know about "AI is getting more left" as a headline.
Models versus the American public
There are no official numbers for where real people would land on this exact test, because the site keeps no statistics on who takes it. But twelve of the 62 propositions line up closely with real US polling: Gallup on the death penalty and marijuana, Pew on whether you need religion to be moral and whether business needs regulating, the GSS on spanking and pornography. For those twelve I can put the models next to actual Americans, with the sources linked.

On ten of the twelve, the models take the same side as the American majority and then push it much harder. Where the public agrees by 58 to 71 percent, the models agree in basically 100 percent of runs. Where the public disagrees by 68 to 88 percent, the models disagree 97 to 100 percent of the time. Same direction as most Americans, just with the volume turned all the way up.
The two exceptions are the two questions where the American majority sits on the authoritarian side: the death penalty (53 percent of Americans in favour) and spanking children (52 percent). On both of those the models break the other way, agreeing 4 and 3 percent of the time. So on the rare question where they part with the majority, they always part toward the libertarian side.
Some of the distance between the models and the public is just this. Real populations are split 60/40 on things, and the models answer as if it were 100/0. Answer like a unanimous version of a 60 percent majority and you land much further out than the majority itself ever would.
So is it just the quiz? I checked the arithmetic.
By now there is an obvious objection: maybe the test itself is tilted, and the dots say more about politicalcompass.org than about the models. This is the part I actually took the scoring apart for, so it is worth answering properly.
The economic axis barely moves no matter how you answer it. Only 18 of the 62 questions touch it at all, and they are split evenly: nine push you right when you agree and nine push you left. Agree with all 62 statements and you come out at economic +0.4. Disagree with all 62 and you come out at -0.3. Neither one gets you anywhere near the -6 the models actually score. You do not reach the economic left by being agreeable or by being contrary. You reach it by agreeing with specific left wing statements and disagreeing with specific right wing ones, which is exactly what the models do.
The social axis is a little softer. More of its questions read as authoritarian when you agree (31 of them) than as libertarian (12), so a model that just likes to say yes drifts a bit toward authoritarian, and one that likes to say no drifts toward libertarian. Worth noticing which way that goes. The usual complaint is that the test manufactures lib-left dots, but pure agreeableness would push you the authoritarian way, not the libertarian way. And a coin flip lands you at dead centre, (0, 0), which is where I said random answering lands right at the start.
So the social axis has a small loophole worth a point or two, and the economic axis has none. The models are far past what either could explain. I am not handing out the recovered scoring, as I said, but that is what it does.
The mirror test
There is a sneakier version of the agreeableness worry. Models are trained to be accommodating, and even if the social axis only leaks a point or two from that, I wanted to rule it out properly.
So I wrote all 62 propositions backwards. "The rich are too highly taxed" became "The rich are not too highly taxed," and so on for every single one, and I ran the whole test again, 30 more times per model, on the reversed version. The logic is simple: a model that is really just agreeing will agree with a statement and then also agree with its opposite, and its two dots will cancel out. A model that is answering based on the content will give opposite answers to the two versions, and its dots will hold.
They hold. For each model I add up how often it agreed on the original and how often it agreed on the mirror. Pure yes saying would score +1. Answering on content alone scores 0. All sixteen models land between -0.14 and +0.05, right up against pure content. If you average each model's original and mirrored dot together, its position moves by half a point to two points, and not a single model leaves the lib-left quadrant or even comes close to the edge.

That is the hardest test-side objection I could think of, and the result walks straight through it. Whatever is going on here survives reversing every question, so it is not coming from the scoring key and it is not simple politeness.
What this doesn't show
A few things this does not show, so nobody has to email me about them:
- It is one setup, in one language. Forced choice, no neutral option, the same instructions every time, all in English. Other researchers (Röttger et al., 2024) have shown that this kind of test can move around a lot when you reword the framing. My 30 reruns make each dot solid; they do not map out what happens under every possible wording.
- I ran the four Claude models through Claude Code, which wraps them in its own system prompt, rather than through the plain chat app. So the Claude answers here might carry slightly different biases than the chat versions would. Every model got byte for byte identical questions, so this caveat is Claude's alone.
- Sampling settings are not identical across providers (GPT-5.x will not let you set a temperature, for instance). The positions hold up fine regardless; the run to run spread numbers are indicative, not exact.
- The reversed questions are my own wording. Seven of the 62 were awkward to flip cleanly and are flagged in the data. Drop those seven and no corrected dot moves by more than a quarter of a point.
- Order matters a little. Shuffling the questions moved most models by under half a point, but it shoved the two Mistrals by 1.7 and 2.5. It never moved anyone out of their quadrant.
- The test is from 2001 and people argue about it for all sorts of reasons that have nothing to do with the scoring. I checked what the scoring does with a set of answers, not whether the questions themselves are fair. A coin flipper landing at the origin does not make the origin the true centre of any real population.
Downloads
You do not have to trust me on any of this. The results are all public:
- The full dataset, one zip: every answer from every model on every run, all 69,440 of them, the full verbatim model outputs, the 30-per-model self estimates, the exact prompts, and a manifest listing every file.
- passes.csv: one row per run, with its scored position, agreement share and parse status.
- instrument.csv: all 62 propositions with their mirrored versions.
- self_estimates.csv: every model's 30 guesses about where it thinks it lands.
- genpop_items.json: every public opinion figure with its source.
I am not publishing the scoring I reverse engineered from politicalcompass.org. That one is theirs. Everything above is enough to check every claim I have made about the models.
I run unslop.run, which measures AI text with error bars first. This is the third of these write-ups.